specplot
Read a SPEC data file and plot a thumbnail image.
This code can be called as a standalone program or it can be imported into another program and called as a subroutine, as shown in the specplot_gallery program.
The standard representation of a SPEC scan is a line plot of the last data column versus the first data column. Any SPEC macro which name ends with scan ([1]) will be plotted as a line plot.
A special case SPEC scan macro is the hklscan where one of the three reciprocal space axes is scanned while the other two remain constant. A special handler (SPEC’s hklscan macro) is provided to pick properly the scanned axis (not always the first column) for representation as a line plot.
Some SPEC macros scan two positioners over a grid to collect a 2-D image one pixel at a time. These scans are represented as color-mapped images where the first two columns are the vertical and horizontal axes and the image is color-mapped to intensity. Any SPEC macro which name ends with mesh will be plotted as an image plot.
| [1] | scan: any scan where the last four letters converted to lower case match scan, such as ascan, a2scan, Escan, tscan, uascan, FlyScan, unusual_custom_user_scan, … |
Different handling can be customized for scan macros, as described in How to write a custom scan handling for specplot.
How to use specplot
Plot a scan from one of the sample data files supplied with spec2nexus:
user@host ~$ specplot src/spec2nexus/data/APS_spec_data.dat 2 specplot.png
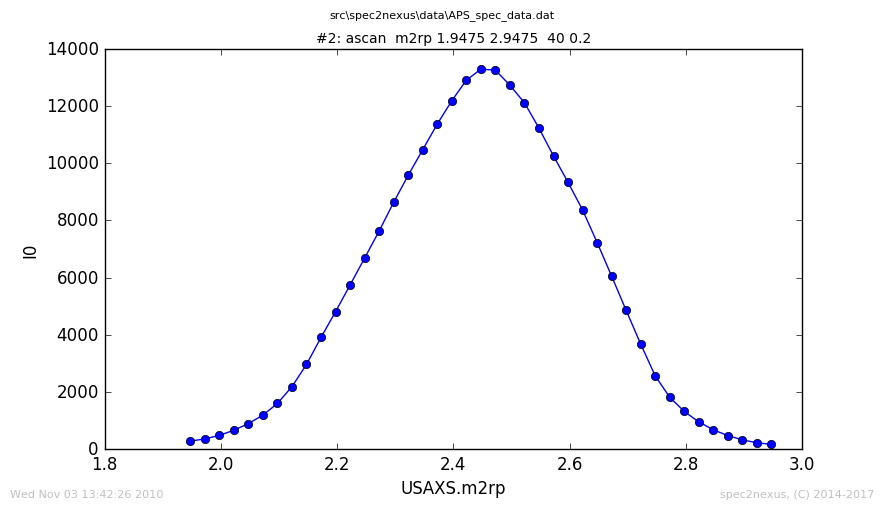
Plot of scan #2 from example data file APS_spec_data.dat.
Usage
user@host ~$ specplot
usage: specplot.py [-h] specFile scan_number plotFile
Help
user@host ~$ specplot -h
usage: specplot.py [-h] specFile scan_number plotFile

read a SPEC data file and plot scan n

positional arguments:
  specFile     SPEC data file name
  scan_number  scan number in SPEC file
  plotFile     output plot file name

optional arguments:
  -h, --help   show this help message and exit