specplot
Read a SPEC data file and plot a thumbnail image.
This code can be called as a standalone program or it can be imported into another program and called as a subroutine, as shown in the specplot_gallery program.
The standard representation of a SPEC scan is a line plot of the last data column versus the first data column. Any SPEC macro which name ends with scan ([1]) will be plotted as a line plot.
A special case SPEC scan macro is the hklscan where one of the three reciprocal space axes is scanned while the other two remain constant. A special handler (SPEC’s hklscan macro) is provided to pick properly the scanned axis (not always the first column) for representation as a line plot.
Some SPEC macros scan two positioners over a grid to collect a 2-D image one pixel at a time. These scans are represented as color-mapped images where the first two columns are the vertical and horizontal axes and the image is color-mapped to intensity. Any SPEC macro which name ends with mesh will be plotted as an image plot.
| [1] | scan: any scan where the last four letters converted to lower case match scan, such as ascan, a2scan, Escan, tscan, uascan, FlyScan, unusual_custom_user_scan, … |
Different handling can be customized for scan macros, as described in How to write a custom scan handling for specplot.
How to use specplot
Plot a scan from one of the sample data files supplied with spec2nexus:
user@host ~$ specplot src/spec2nexus/data/APS_spec_data.dat 2 specplot.png
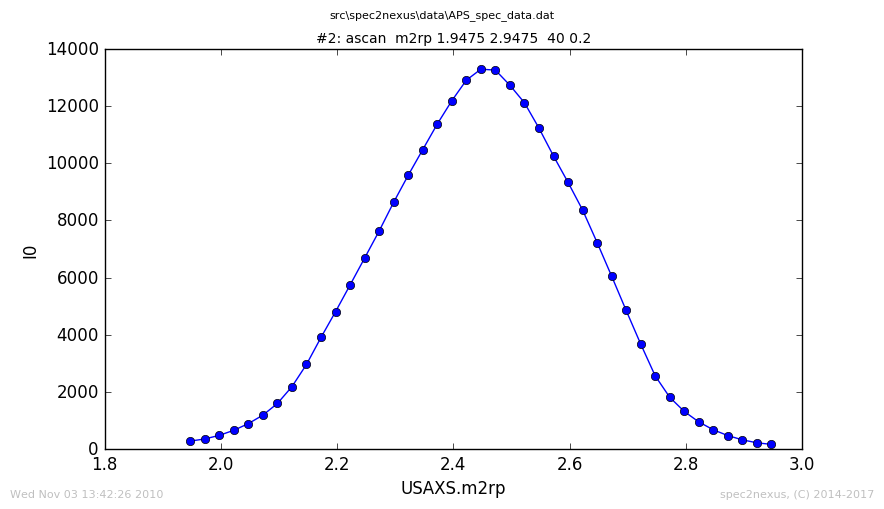
Plot of scan #2 from example data file APS_spec_data.dat.
Usage
user@host ~$ specplot
usage: specplot.py [-h] specFile scan_number plotFile
Help
user@host ~$ specplot -h
usage: specplot.py [-h] specFile scan_number plotFile

read a SPEC data file and plot scan n

positional arguments:
  specFile     SPEC data file name
  scan_number  scan number in SPEC file
  plotFile     output plot file name

optional arguments:
  -h, --help   show this help message and exit
source code documentation
Plot the data from scan N in a SPEC data file
Selector() |
associate SPEC scan macro names with image makers |
ImageMaker() |
superclass to handle plotting of data from a SPEC scan |
LinePlotter() |
create a line plot |
MeshPlotter() |
create a mesh plot (2-D image) |
openSpecFile(specFile) |
convenience routine so that others do not have to import spec2nexus.spec |
Exceptions:
NoDataToPlot |
No data found. |
NotPlottable |
No plottable data for this scan. |
ScanAborted |
Scan aborted before all points acquired. |
UnexpectedObjectTypeError |
Incorrect Python object type: programmer error. |
-
class
spec2nexus.specplot.ImageMaker[source]¶ superclass to handle plotting of data from a SPEC scan
Internal data model
Signal: name of the signaldata (default data to be plotted)Data: values of various collected arrays {label: array} Axes: names of the axes of signal data USAGE:
Create a subclass of
ImageMakerOverride any of these methods:
data_file_name()the name of the file with the actual data make_image(plotFile)make MatPlotLib chart image from the SPEC scan plottable()can this data be plotted as expected? plot_options()re-define any plot options in a subclass retrieve_plot_data()retrieve default plottable data from spec data file and store locally
EXAMPLE
class LinePlotter(ImageMaker):
    '''create a line plot'''

    def make_image(self, plotFile):
        '''
        make MatPlotLib chart image from the SPEC scan

        :param obj plotData: object returned from :meth:`retrieve_plot_data`
        :param str plotFile: name of image file to write
        '''
        assert(self.signal in self.data)
        assert(len(self.axes) == 1)
        assert(self.axes[0] in self.data)

        y = self.data[self.signal]
        x = self.data[self.axes[0]]
        xy_plot(x, y,  plotFile,
               title = self.plot_title(),
               plot_subtitle = self.plot_subtitle(),
               xtitle = self.x_title(),
               ytitle = self.y_title(),
               xlog = self.x_log(),
               ylog = self.y_log(),
               timestamp_str = self.timestamp())

sfile = specplot.openSpecFile(specFile)
scan = sfile.getScan(scan_number)
plotter = LinePlotter()
plotter.plot_scan(scan, plotFile, y_log=True)
-
data_file_name()[source]¶ the name of the file with the actual data
Usually, this is the SPEC data file but it could be something else
-
data_is_newer_than_plot(plotFile)[source]¶ only proceed if mtime of SPEC data file is newer than plotFile
-
make_image(plotFile)[source]¶ make MatPlotLib chart image from the SPEC scan
The data to be plotted are provided in:
- self.signal
- self.axes
- self.data
Parameters: plotFile (str) – name of image file to write
-
plot_scan(scan, plotFile, maker=None)[source]¶ make an image plot of the data in the scan
Parameters: - scan (obj) – instance of
SpecDataFileScan - plotFile (str) – file name for plot output
- scan (obj) – instance of
-
retrieve_plot_data()[source]¶ retrieve default plottable data from spec data file and store locally
This method must retrieve the data to be plotted, either from the SPEC data file scan or from a file which name is provided in the scan detalis.
These attributes must be set by this method:
Data: dictionary containing values of the various collected arrays {label: array} Signal: name of the ‘signal’ data (default data to be plotted) Axes: names of the axes of signal data Example data
self.data = {
    'angle': [1, 2, 3, 4, 5],
    'counts': [0. 2. 55. 3. 0]}
self.signal = 'counts'
self.axes = ['angle']
Raise any of these exceptions as appropriate:
NoDataToPlotNo data found. NotPlottableNo plottable data for this scan. ScanAbortedScan aborted before all points acquired.
-
class
spec2nexus.specplot.LinePlotter[source]¶ create a line plot
-
class
spec2nexus.specplot.MeshPlotter[source]¶ create a mesh plot (2-D image)
..rubric:: References:
Mesh 2-D parser: http://www.certif.com/spec_help/mesh.html
mesh motor1 start1 end1 intervals1 motor2 start2 end2 intervals2 time
Hklmesh 2-D parser: http://www.certif.com/spec_help/hklmesh.html
hklmesh Q1 start1 end1 intervals1 Q2 start2 end2 intervals2 time
-
class
spec2nexus.specplot.Selector[source]¶ associate SPEC scan macro names with image makers
Image maker: subclass of ImageMakerTo include a custom image maker from outside this module, create the subclass and then add it to an instance of this class. Such as this plotter that defaults to a logarithmic scale for the X axis for all logxscan macros:
from spec2nexus import specplot
class LogX_Plotter(specplot.ImageMaker):
- def x_log(self):
- return True
# …
selector = specplot.Selector() selector.add(‘logxscan’, LogX_Plotter)
# …
image_maker = specplot.Selector().auto(scan) plotter = image_maker() plotter.plot_scan(scan, fullPlotFile)
This class is a singleton which means you will always get the same instance when you call this class many times in your program.
auto(scan)automatically choose a scan image maker based on the SPEC scan macro add(key, value[, default])register a new value by key update(key, value[, default])replace an existing key with a new value get(key)return a value by key exists(key)is the key known? default()retrieve the value of the default key -
add(key, value, default=False)[source]¶ register a new value by key
Parameters: key (str) – name of key, typically the macro name
Raises: - KeyError – if key exists
- UnexpectedObjectTypeError – if value is not subclass of
ImageMaker
-
auto(scan)[source]¶ automatically choose a scan image maker based on the SPEC scan macro
Selection Rules:
- macro ends with “scan”: use
LinePlotter - macro ends with “mesh”: use
MeshPlotter - default: use default image maker (initially
LinePlotter)
- macro ends with “scan”: use
-
get(key)[source]¶ return a value by key
Returns: subclass of ImageMakeror None if key not found
-
update(key, value, default=False)[source]¶ replace an existing key with a new value
Parameters: key (str) – name of key, typically the macro name
Raises: - KeyError – if key does not exist
- UnexpectedObjectTypeError – if value is not subclass of
ImageMaker